What is WSPR ?
What is WSPR ?
WSPR stands for Weak Signal Propagation Reporter. It is a software program designed to probe potential radio propagation paths, in contrast to most other digital modes which enable messaging between stations. WSPR is one of several extremely low bandwidth, low power digital communication modes invented by the eminent Professor Joe Taylor K1JT. By low bandwidth we note that each WSPR message comprises only 50 bits and 6 Hz of bandwidth. The total bandwidth allocated for all WSPR stations active simultaneously in any one of our Amateur bands is 200Hz. By low power a maximum of 5Watts is recommended and many stations use 1 Watt or less.
Probing propagation requires the collection and analysis of received data. For every contact between two stations, the data recorded at each end includes accurate time in UTC signal to noise ratio in dB, time offset in seconds, actual frequency and the drift rate of the signal in Hz/minute, 4-digit grid location and transmitted power in dBm. This data has been stored in a database for every contact for many years and enables propagation research in relation to other events such as sunspot cycle, magnetic storms, greyline conditions and so on. There is data for all amateur bands from 600m to VHF and above. An associated program called WSPRnet provides some statistics and a world map of activity
What equipment is required ? The frequency stability required(<1Hz/minute) would rule out most legacy radios but modern DSB transceivers would likely be satisfactory. A computer running WSPR software(Windows, Linux, or OSX) needs to have a CPU speed of 1.5GHz or greater and at least 100MB of available RAM. WSPR is processed by a computer’s sound card or equivalent and connected to the radio via twin audio cables and a means of T/R switching control. With powerSDR radios these audio, PTT and rig control signals are carried as virtual cables via a 1Gbps ethernet cable.
What does a user experience when running WSPR ?
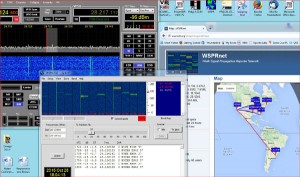
A general idea can be gained by looking at the following image which is a composite of screens from an Anan 100D radio, WSPR and a WSPRnet software. The top left hand panel shows the PowerSDR interface running WSPR on 10m. The grey band on the panadapter is the bandwidth of the radio filter which I use for SSB and 10x greater than needed for WSPR. You can see a very strong WSPR signal in the spectrum and in the waterfall. Often WSPR will decode received signals that can barely be distinguished by eye in the noise.
The screen below and left is the WSPR interface. The upper bar shows signals each lasting 2 minutes that came in over the 15 minutes. To the right there is scale where the desired tx frequency can be selected in the 200Hz band, WSPR has robust error tolerance when two WSPR signals overlap, The lowest part of this frame shows the data decoded from a few signals.
The final screen is one type generated by WSPRnet. This was a “dead” 10m band, it shows the light/dark contour, some US contacts and the DX station in Argentina. My output power was only 4 Watts. Note the signal levels from N0CXX, initially in the -20s improved to -8 dB. The explanation is that I switched from a vertical to a N-S inverted vee antenna between 1724 and 1800 UTC. Curious minds might wonder why all received WSPR SNR values are in negative dBs suggesting that the signals are below the noise . It may be noted that WSPR refers noise to a 2500 Hz band of spectrum. WSPR signals require just a few Hz so there is a very large adjustment to obtain absolute numbers. Shannon’s law relates information capacity of a channel to bandwidth and recognizes noise is in proportion to bandwidth. Smart as WSPR is, Shannon’s law is not invalidated.
WSPR can be downloaded from http://www.physics.princeton.edu/pulsar/k1jt/
Help understanding sound the sound card interface can be found at http://www.w5bbr.com/soundbd.html
WSPRnet can be obtained from http;//wsprnet.org/
WSPR is magical and amazing science.
—Ron W6WO
